[edit]
1 four.plot #
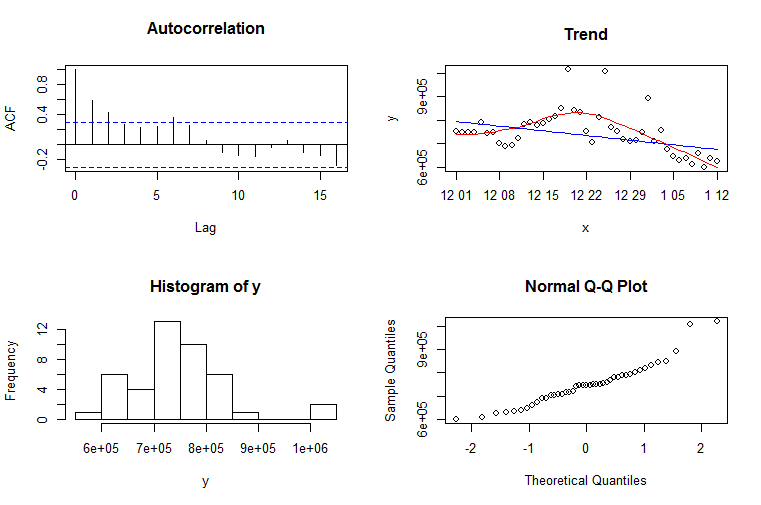
four.plot <- function(y, xlabels){
    par(mfrow=c(2,2))

    acf(y, main="Autocorrelation")

    x <- xlabels
    plot(x,y, main="Trend")
    fit1 <- rlm(y~x)
    lines(x, predict(fit1, data.frame(x=x)), col="blue")
    x <- 1:length(y)
    fit2 <- loess(y~x)
    pred <- predict(fit2, data.frame(x=x))
    x <- xlabels
    lines(x, pred, col="red")

    hist(y)
    qqnorm(y)

    par(mfrow=c(1,1))
}