Contents

1
2 ろ 一危 襷り鍵
3 一 覲, 伎壱 覲, Missing Value
4 Missing Value
5 Histogram
6 Density
7 BoxPlot
8 Correlation
9 Categorical
10 Automating EDA


--豢豌: https://www.r-bloggers.com/how-to-automate-eda-with-dataexplorer-in-r/

1 #

install.packages("DataExplorer")
library(DataExplorer)

2 ろ 一危 襷り鍵 #

mydata <- iris
mydata[5:50, 3] <- NA
mydata$Species <- as.factor(mydata$Species)
head(mydata)

3 一 覲, 伎壱 覲, Missing Value #

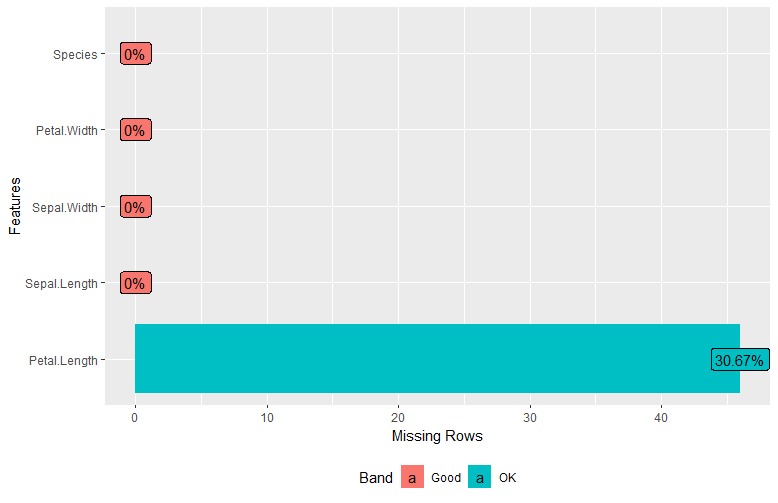
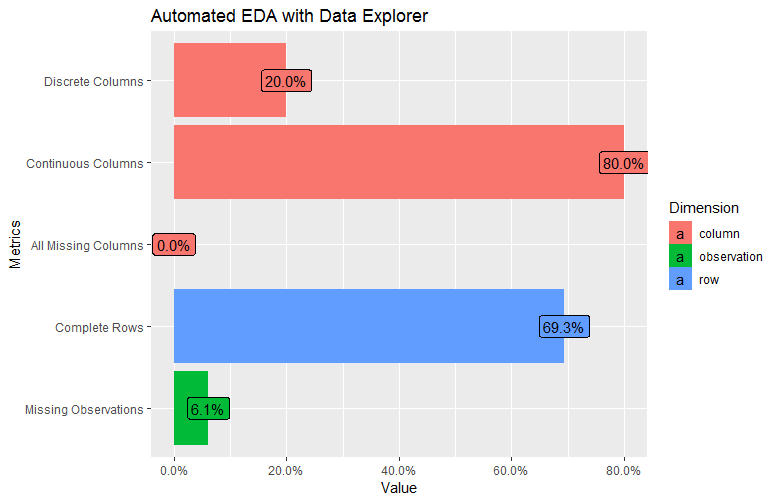
plot_intro(mydata, title = "Automated EDA with Data Explorer")

1.png

4 Missing Value #

plot_missing(mydata)
2.png

5 Histogram #

plot_histogram(mydata)
3.png

6 Density #

plot_density(mydata)
4.png

7 BoxPlot #

plot_boxplot(mydata, by= 'Species',  ncol = 2)
5.png

8 Correlation #

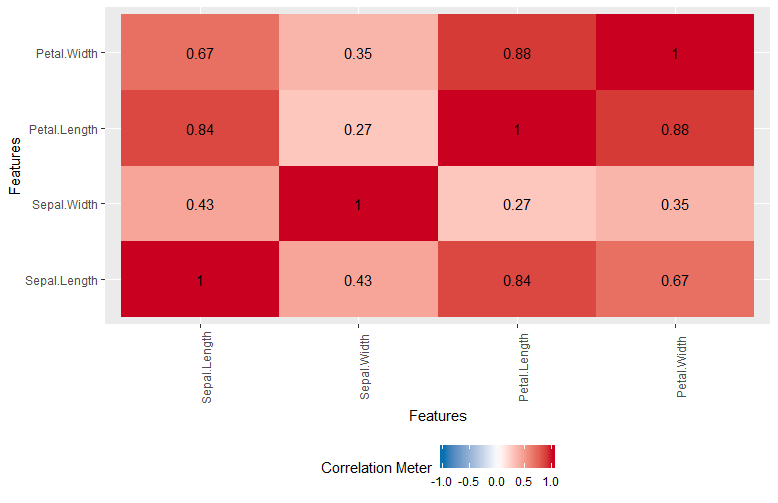
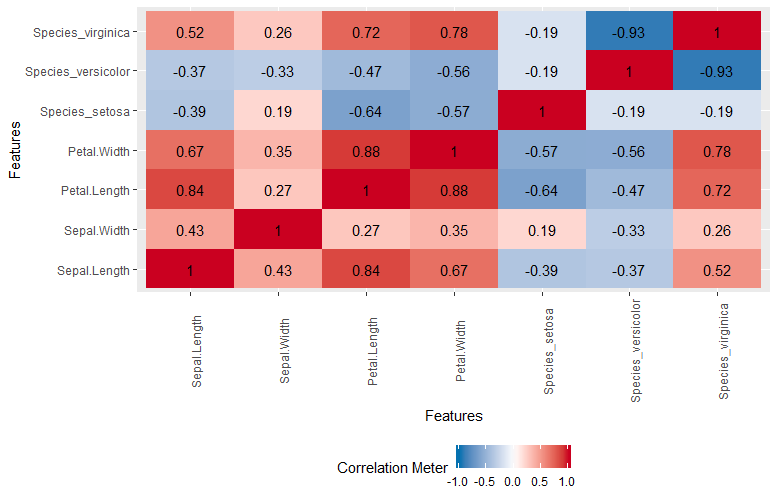
plot_correlation(mydata, cor_args = list( 'use' = 'complete.obs'))
6.png

plot_correlation(mydata, type = 'c', cor_args = list( 'use' = 'complete.obs'))
7.png

9 Categorical #

plot_bar(mydata$Species, maxcat = 20)
#plot_bar(mydata, maxcat = 20, parallel = TRUE) #Windows OS 讌 
8.png

plot_bar(mydata, with = c("Sepal.Length"), maxcat = 20)
#plot_bar(mydata, with = c("Sepal.Length"), maxcat = 20, parallel = TRUE)
9.png

10 Automating EDA #

企蟆 覃 Data Profiling Report螳 襷れ 讌.
create_report(mydata)