[edit]
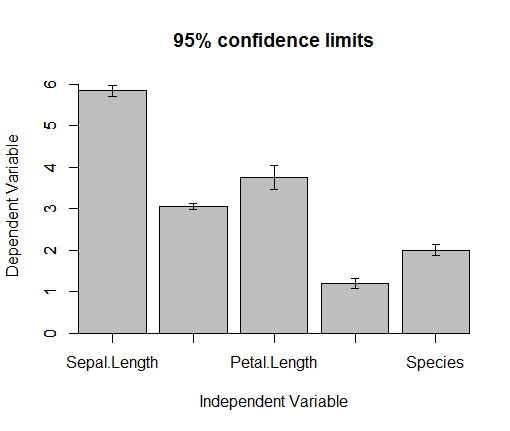
1 error.bars #
install.packages("psych")
library(psych)
error.bars(iris,bar=TRUE)
add.error.bars <- function(X,Y,SE,w,col=1){
    X0 = X; Y0 = (Y-SE); X1 =X; Y1 = (Y+SE);
    arrows(X0, Y0, X1, Y1, code=3,angle=90,length=w,col=col);
}
plot(x,y, ylim=c(lwr,upr))
add.error.bars(last(x), last(val), pred$se, 0.1, "red")
data(ToothGrowth)
head(ToothGrowth)


library(plyr)
## Summarizes data.
## Gives count, mean, standard deviation, standard error of the mean, and confidence interval (default 95%).
##   data: a data frame.
##   measurevar: the name of a column that contains the variable to be summariezed
##   groupvars: a vector containing names of columns that contain grouping variables
##   na.rm: a boolean that indicates whether to ignore NA's
##   conf.interval: the percent range of the confidence interval (default is 95%)
summarySE <- function(data=NULL, measurevar, groupvars=NULL, na.rm=FALSE,
                      conf.interval=.95, .drop=TRUE) {
  require(plyr)

  # New version of length which can handle NA's: if na.rm==T, don't count them
  length2 <- function (x, na.rm=FALSE) {
    if (na.rm) sum(!is.na(x))
    else       length(x)
  }

  # This does the summary. For each group's data frame, return a vector with
  # N, mean, and sd
  datac <- ddply(data, groupvars, .drop=.drop,
                 .fun = function(xx, col) {
                   c(N    = length2(xx[[col]], na.rm=na.rm),
                     mean = mean   (xx[[col]], na.rm=na.rm),
                     sd   = sd     (xx[[col]], na.rm=na.rm)
                   )
                 },
                 measurevar
  )

  # Rename the "mean" column
  datac <- rename(datac, c("mean" = measurevar))

  datac$se <- datac$sd / sqrt(datac$N)  # Calculate standard error of the mean

  # Confidence interval multiplier for standard error
  # Calculate t-statistic for confidence interval:
  # e.g., if conf.interval is .95, use .975 (above/below), and use df=N-1
  ciMult <- qt(conf.interval/2 + .5, datac$N-1)
  datac$ci <- datac$se * ciMult

  return(datac)
}

dfc <- summarySE(ToothGrowth, measurevar="len", groupvars=c("supp","dose"))

library(ggplot2)
pd <- position_dodge(.1)
ggplot(dfc, aes(x=dose, y=len, colour=supp)) +
  geom_errorbar(aes(ymin=len-se, ymax=len+se), width=.1, position=pd) +
  geom_line(position=pd) +
  geom_point(position=pd)

pd <- position_dodge(.1)


dfc2 <- dfc
dfc2$dose <- factor(dfc2$dose)

# Use 95% confidence intervals instead of SEM
ggplot(dfc2, aes(x=dose, y=len, fill=supp)) +
  geom_bar(position=position_dodge(), stat="identity") +
  geom_errorbar(aes(ymin=len-ci, ymax=len+ci),
                width=.2,                    # Width of the error bars
                position=position_dodge(.9))