[edit]
2 ΉαΙΉιε #
ΈΞ░Ήζ┤ΊΕ░
n = 100
g = 6
set.seed(g)
d <- data.frame(x = unlist(lapply(1:g, function(i) rnorm(n/g, runif(1)*i^2))),
                y = unlist(lapply(1:g, function(i) rnorm(n/g, runif(1)*i^2))))
library(fpc)
library("cluster")
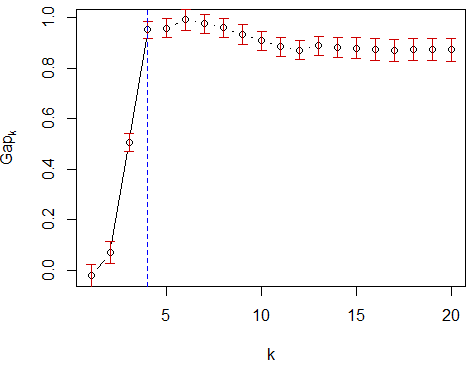
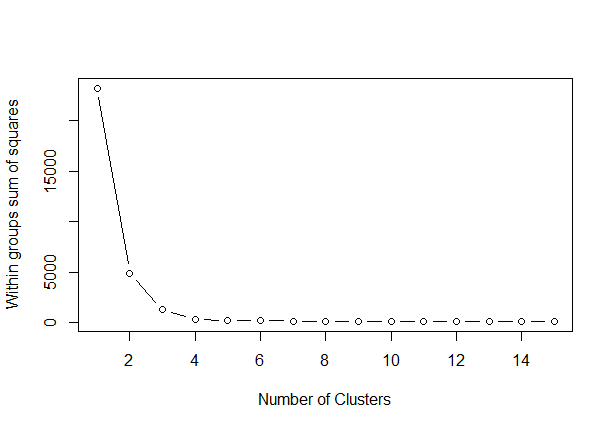
#Ή╡εΉιΒΉζα kΆ░ΤΉζΕ Ή░╛ΉζΝ
#k <- pamk(d)$nc
k <- pamk(d)$nc+1
cl <- pam(d, k)
result <- data.frame(d, clusterid=cl$clustering)
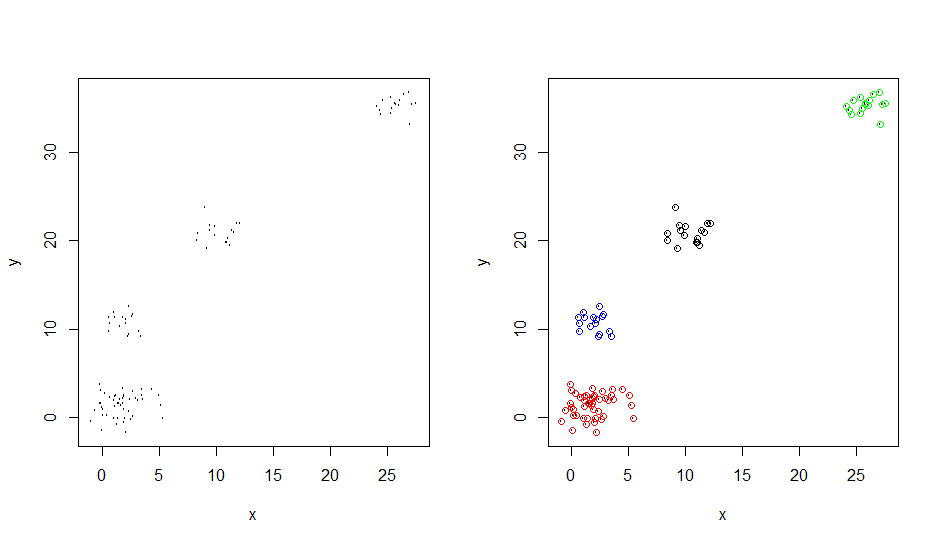
par(mfrow=c(1,2))
plot(d, cex=0.2)
plot(d, cex=0.2)
colour <- c("red", "blue", "black", "green")
points(result$x, result$y, col=c(colour[result$clusterid]))
par(mfrow=c(1,1))