[edit]
예제 #
import numpy as np
from scipy.optimize import curve_fit
import pandas as pd
import io
import matplotlib.pyplot as plt
txt = io.StringIO("""
nth retention
1 100
2 50
3 45
4 40
5 38
6 35
7 33
14 25
30 20
60 15
90 14
120 13
180 13
360 10
""")
df = pd.read_csv(txt, sep="\t")
df
x = np.array(df.nth)
y = np.array(df.retention)
def func(x, p1, p2, p3, p4, p5, p6):
return p1*np.exp(p2*x) + p3*np.exp(p4*x) + p5*np.exp(p6*x)
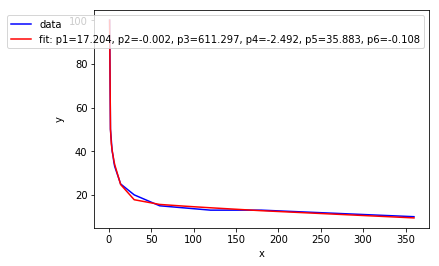
popt, pcov = curve_fit(func, x, y, p0=(0.0, 0.0, 0.0, 0.0, 0.0, 0.0))
plt.plot(x, y, 'b-', label='data')
plt.plot(x, func(x, *popt), 'r-',
label='fit: p1=%5.3f, p2=%5.3f, p3=%5.3f, p4=%5.3f, p5=%5.3f, p6=%5.3f' % tuple(popt))
plt.xlabel('x')
plt.ylabel('y')
plt.legend()
plt.show()
결과