[edit]
2 šš 2 #
# install.packages("quantreg")
library("quantreg")
data(engel)
head(engel)
> head(engel)
    income  foodexp
1 420.1577 255.8394
2 541.4117 310.9587
3 901.1575 485.6800
4 639.0802 402.9974
5 750.8756 495.5608
6 945.7989 633.7978
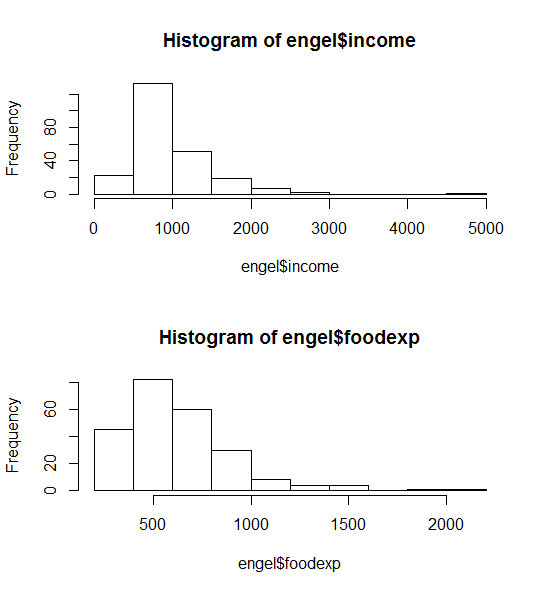
par(mfrow=c(2,1))
hist(engel$income)
hist(engel$foodexp)
par(mfrow=c(1,1))
f<-rq((engel$foodexp)~(engel$income),tau=c(0.05,0.1,0.25,0.5,0.75,0.9,0.95))
f
fit <- rq(foodexp ~ income, data=engel, tau = c(0.05, 0.1, 0.25, 0.5, 0.75, 0.9, 0.95))
fit
õý¯õ°¥
> f
Call:
rq(formula = (engel$foodexp) ~ (engel$income), tau = c(0.05,
    0.1, 0.25, 0.5, 0.75, 0.9, 0.95))

Coefficients:
               tau= 0.05   tau= 0.10  tau= 0.25  tau= 0.50  tau= 0.75  tau= 0.90  tau= 0.95
(Intercept)  124.8800408 110.1415742 95.4835396 81.4822474 62.3965855 67.3508721 64.1039632
engel$income   0.3433611   0.4017658  0.4741032  0.5601806  0.6440141  0.6862995  0.7090685

Degrees of freedom: 235 total; 233 residual
predict š¯¡õ°
data(airquality)
airq <- airquality[143:145,]
f <- rq(Ozone ~ ., data=airquality)
predict(f,newdata=airq)
f <- rq(Ozone ~ ., data=airquality, tau=1:19/20)
fp <- predict(f, newdata=airq, stepfun = TRUE)
fpr <- rearrange(fp)
plot(fp[[2]],main = "Ozone Prediction")
par(col="red")
lines(fpr[[2]])
legend(.2,20,c("raw","cooked"),lty = c(1,1),col=c("black","red"))