Contents

1 蠏碁9覲 plot
2 譴 れ 殊語姶
3 mclust
4 scotter plot & smooth line
5 treemap


1 蠏碁9覲 plot #

colour <- c("red", "black")
plot(tmp$seq, tmp$up, col=c(colour[tmp$choice]))
plot(tmp$seq, tmp$up, pch=tmp$choice)

2 譴 れ 殊語姶 #

lg <- c("覓", "豕螻")
cl <- c("blue", "red")
plot(scale(x$gift), type="l", col=cl[1])
lines(scale(x$mcu), col=cl[2])
legend(1.5, 2.4,lg, lty="solid", col=cl)


out3 <- survfit(Surv(time, status==1) ~ , data=x1)
plot(out3, col=c(1:7), lty=1:7)
legend.txt <- c("","","","","覈","蠍","")
legend("topright", legend=legend.txt, col=1:7, lty=1:7)
summary(out3)

3 mclust #

install.packages("mclust")
library("mclust")

education <- read.csv("http://datasets.flowingdata.com/education.csv", header=T)
head(education)

> head(education)
state reading math writing percent_graduates_sat pupil_staff_ratio dropout_rate
1 United States     501  515     493                    46               7.9          4.4
2       Alabama     557  552     549                     7               6.7          2.3
3        Alaska     520  516     492                    46               7.9          7.3
4       Arizona     516  521     497                    26              10.4          7.6
5      Arkansas     572  572     556                     5               6.8          4.6
6    California     500  513     498                    49              10.9          5.5

#2~7願讌襯 伎 企Μ 蟇磯Μ襯 蟲.
ed.dis <- dist(education[,2:7])
#cmdscale -> 蟇磯Μ  ル, ル 蟇磯Μ 襷蟆 覦一.
ed.mds <- cmdscale(ed.dis)

x<- ed.mds[,1]
y<- ed.mds[,2]
plot(x,y)
plot(x,y, type='n')
text(x,y, label=education$state)

ed.mclust <- Mclust(ed.mds)
par(mfrow=c(2,2))
plot(ed.mclust, data=ed.mds)


4 scotter plot & smooth line #

require(graphics)

with(cars, scatter.smooth(speed, dist))

## or with dotted thick smoothed line results :
with(cars, scatter.smooth(speed, dist, lpars =
                   list(col = "red", lwd = 3, lty = 3)))


5 treemap #

豢豌: 觜譯殊朱殊伎 , 伎
install.packages("portfolio")
library("portfolio")

posts <- read.csv("http://datasets.flowingdata.com/post-data.txt")
head(posts)

> head(posts)
id  views comments               category
1 5019 148896       28 Artistic Visualization
2 1416  81374       26          Visualization
3 1416  81374       26               Featured
4 3485  80819       37               Featured
5 3485  80819       37                Mapping
6 3485  80819       37           Data Sources

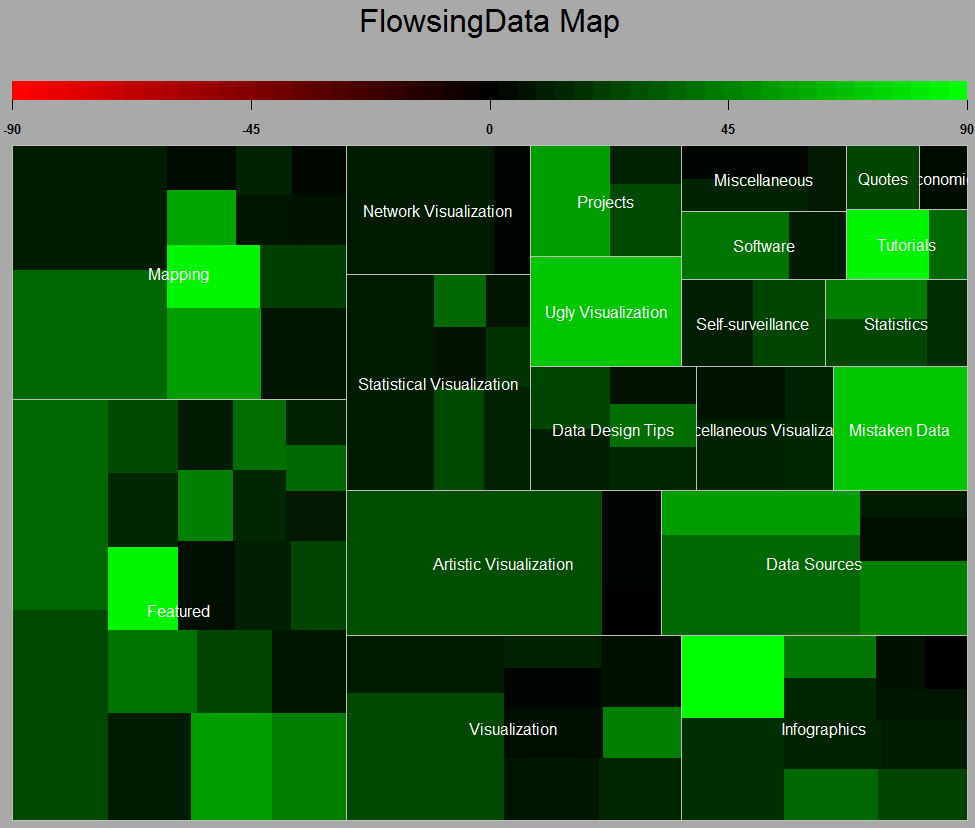
with(posts, map.market(
  id=id, area=views, 
  group=category, color=comments,
  main="FlowsingData Map"))

treemap.png