[edit]
1 pairs #
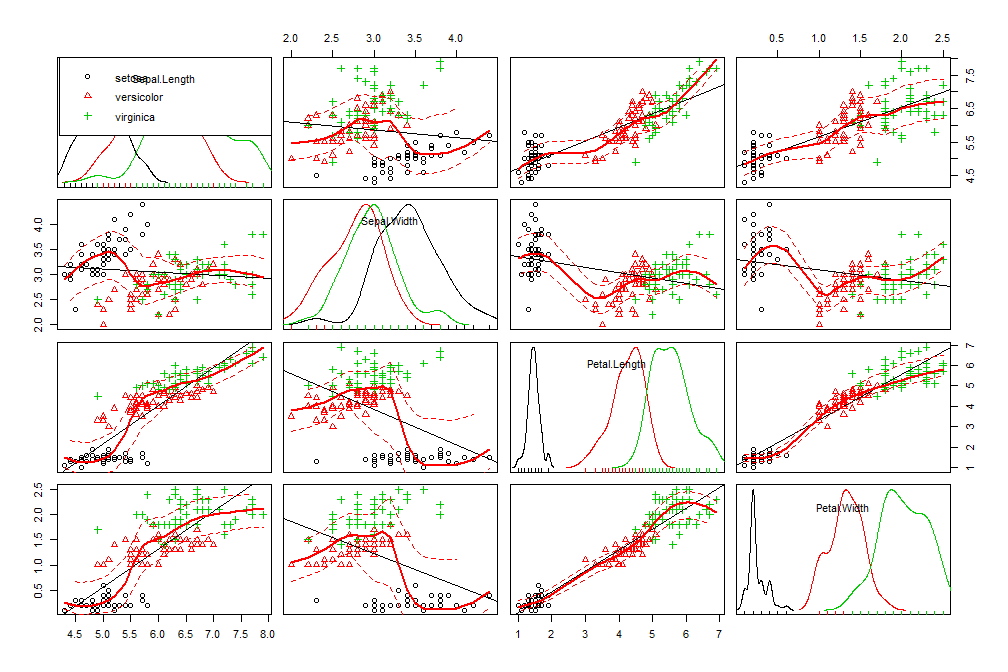
library(car) spm(~Sepal.Length + Sepal.Width + Petal.Length + Petal.Width | Species, data=iris)
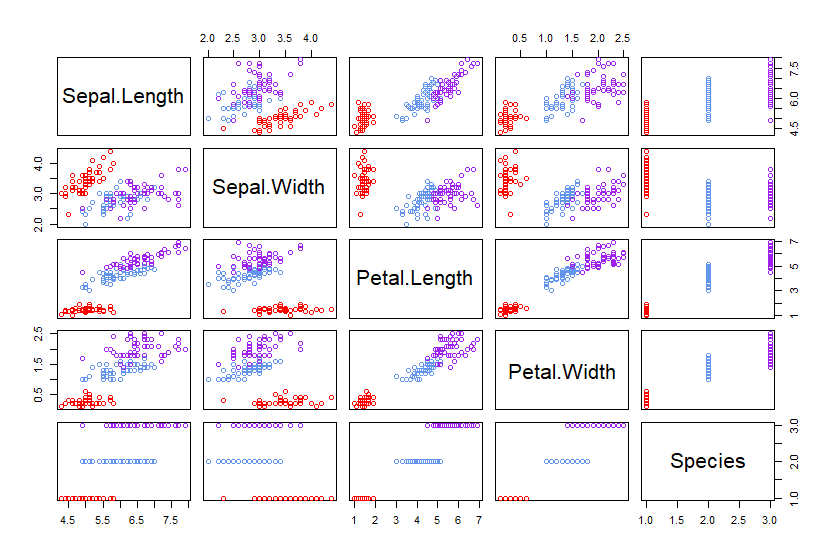
pairs(iris, col = c("red", "cornflowerblue", "purple")[iris$Species])
library("GGally")
ggpairs(train[,3:13], aes(color = is_churn, alpha=0.2))+ theme_bw()
library(car)
spm(~Sepal.Length + Sepal.Width + Petal.Length + Petal.Width | Species, data=iris)
pairs(iris, col = c("red", "cornflowerblue", "purple")[iris$Species])
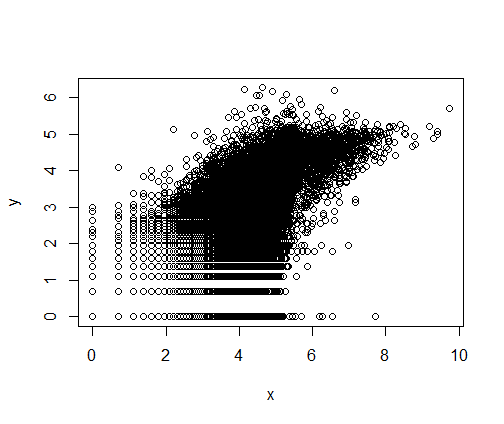
plot(x,y)
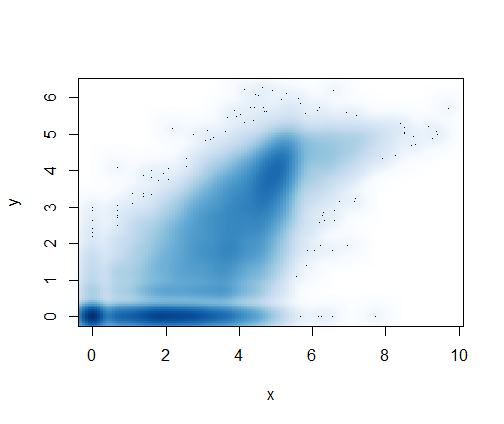
library(graphics)
smoothScatter(x, y)
require(rgl)
pred.surf.3d <- function(df, x.nm,y.nm,z.nm, ...){
x <- df[,x.nm]; y <- df[,y.nm]; z<-df[,z.nm]
fit <- lm(z ~ x + y + x*y + x^2 + y^2)
xnew <- seq(range(x)[1],range(x)[2],len=20)
ynew <- seq(range(y)[1],range(y)[2],len=20)
df <- expand.grid(x=xnew, y=ynew)
df$z <- predict(fit, newdata=df)
with(df, surface3d(xnew, ynew, z=df$z, alpha=0.5))
}
plot3d(mydata$x, mydata$y, mydata$zl, col=rainbow(1000))
pred.surf.3d(mydata, "x", "y", "z")