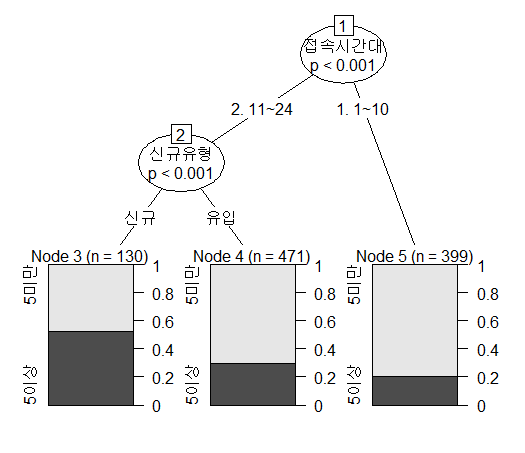
library(party) x <- sqlQuery(conn, "select top 1000 new_type ى‹ ê·œىœ يک•, hh ى ‘ى†چى‹œê°„대, case when time >= 5 then '5ى´ىƒپ' else '5미만' end time from ods.dbo.v_h2 where join_dt = '20120411'") tree <- ctree(time ~ ى‹ ê·œىœ يک• + ى ‘ى†چى‹œê°„대, data=x) #tree <- ctree(time ~ ى‹ ê·œىœ يک• + ى ‘ى†چى‹œê°„대, controls = ctree_control(maxdepth = 5), data=x) plot(tree)
> tree <- randomForest(time ~ ى‹ ê·œىœ يک• + ى ‘ى†چى‹œê°„대, data=x)
> print(tree) # view results
Call:
randomForest(formula = time ~ ى‹ ê·œىœ يک• + ى ‘ى†چى‹œê°„대, data = x)
Type of random forest: classification
Number of trees: 500
No. of variables tried at each split: 1
OOB estimate of error rate: 23.39%
Confusion matrix:
10미만 10ى´ىƒپ class.error
10미만 1736 0 0
10ى´ىƒپ 530 0 1
> importance(tree) # importance of each predictor
MeanDecreaseGini
ى‹ ê·œىœ يک• 18.15337
ى ‘ى†چى‹œê°„대 9.90380
>
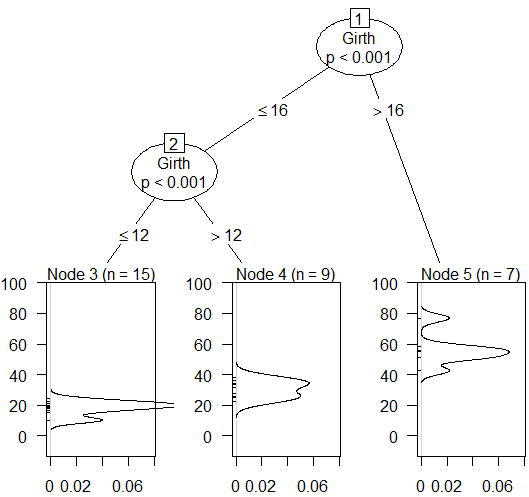
library(party)
tree <- ctree(Volume ~ ., data=trees)
plot(tree, terminal_panel = node_density)
#plot(tree, terminal_panel = node_barplot(tree))
library(partykit)
    airct <- ctree(Ozone ~ ., data = airq)
    class(airct)  # different class from before
    # "constparty" "party"
plot(airct, gp = gpar(fontsize = 6),     # font size changed to 6
  inner_panel=node_inner,
  ip_args=list(
       abbreviate = TRUE,
       id = FALSE)
  )

library(partykit)
tree <- ctree(revisit_cnt ~ ., controls = ctree_control(maxdepth = 5), data = training)
plot(tree, gp = gpar(fontsize = 8))
png("mytree.png",res=80,height=800,width=1600)
plot(mytree)
dev.off()
terminal_node ى»¤ىٹ¤ي„°ë§ˆى´ى§•ي•ک기
http://stackoverflow.com/questions/13959431/how-to-get-all-terminal-nodes-weight-response-prediction-ctree-in-r
http://stackoverflow.com/questions/13959431/how-to-get-all-terminal-nodes-weight-response-prediction-ctree-in-r
library(party)
library(caret)
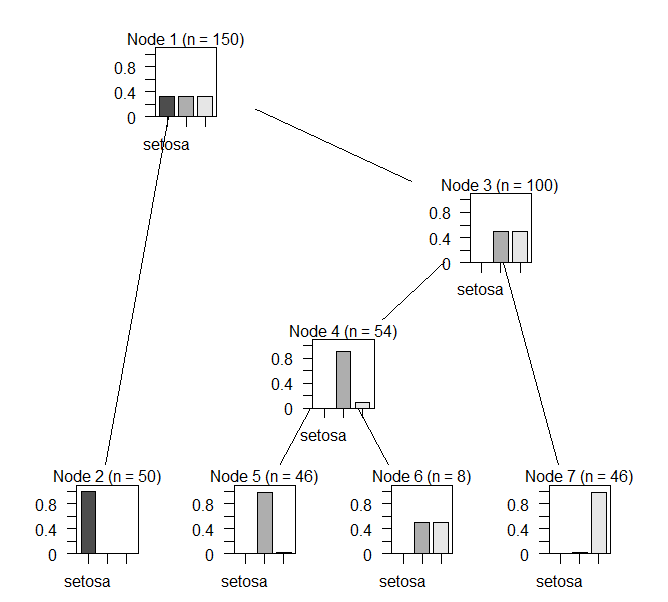
gtree <- ctree(Species ~ ., data = iris)
plot(gtree, inner_panel = node_barplot,
edge_panel = function(...) invisible(), tnex = 1)
treeىک يپ¬ê¸° ى،°ى •ي•ک기
http://stackoverflow.com/questions/13751962/how-to-plot-a-large-ctree-to-avoid-overlapping-nodes
http://stackoverflow.com/questions/13751962/how-to-plot-a-large-ctree-to-avoid-overlapping-nodes
[edit]
bar plot ىˆکيڈ‰ىœ¼ë،œ ى„¸ىڑ°ê¸° #
--http://stackoverflow.com/questions/11961923/rotate-classification-tree-terminal-barplot-axis-r
# Note inclusion of horiz = FALSE
alt_node_barplot <- function (ctreeobj, col = "black", fill = NULL, beside = NULL,
    ymax = NULL, ylines = NULL, widths = 1, gap = NULL, reverse = NULL,
    id = TRUE, horiz = FALSE)
{
    getMaxPred <- function(x) {
        mp <- max(x$prediction)
        mpl <- ifelse(x$terminal, 0, getMaxPred(x$left))
        mpr <- ifelse(x$terminal, 0, getMaxPred(x$right))
        return(max(c(mp, mpl, mpr)))
    }
    y <- response(ctreeobj)[[1]]
    if (is.factor(y) || class(y) == "was_ordered") {
        ylevels <- levels(y)
        if (is.null(beside))
            beside <- if (length(ylevels) < 3)
                FALSE
            else TRUE
        if (is.null(ymax))
            ymax <- if (beside)
                1.1
            else 1
        if (is.null(gap))
            gap <- if (beside)
                0.1
            else 0
    }
    else {
        if (is.null(beside))
            beside <- FALSE
        if (is.null(ymax))
            ymax <- getMaxPred(ctreeobj@tree) * 1.1
        ylevels <- seq(along = ctreeobj@tree$prediction)
        if (length(ylevels) < 2)
            ylevels <- ""
        if (is.null(gap))
            gap <- 1
    }
    if (is.null(reverse))
        reverse <- !beside
    if (is.null(fill))
        fill <- gray.colors(length(ylevels))
    if (is.null(ylines))
        ylines <- if (beside)
            c(3, 2)
        else c(1.5, 2.5)
    # My edit do not work if beside is not true
    #################################################
    if(!beside) horiz = FALSE
    #################################################

    rval <- function(node) {
        pred <- node$prediction
        if (reverse) {
            pred <- rev(pred)
            ylevels <- rev(ylevels)
        }
        np <- length(pred)
        nc <- if (beside)
            np
        else 1
        fill <- rep(fill, length.out = np)
        widths <- rep(widths, length.out = nc)
        col <- rep(col, length.out = nc)
        ylines <- rep(ylines, length.out = 2)
        gap <- gap * sum(widths)
        #######################################################
        if (!horiz){
            yscale <- c(0, ymax)
            xscale <- c(0, sum(widths) + (nc + 1) * gap)
        } else {
            xscale <- c(0, ymax)
            yscale <- c(0, sum(widths) + (nc + 1) * gap)
        }
        #######################################################
        top_vp <- viewport(layout = grid.layout(nrow = 2, ncol = 3,
            widths = unit(c(ylines[1], 1, ylines[2]), c("lines",
                "null", "lines")), heights = unit(c(1, 1), c("lines",
                "null"))), width = unit(1, "npc"), height = unit(1,
            "npc") - unit(2, "lines"), name = paste("node_barplot",
            node$nodeID, sep = ""))
        pushViewport(top_vp)
        grid.rect(gp = gpar(fill = "white", col = 0))
        top <- viewport(layout.pos.col = 2, layout.pos.row = 1)
        pushViewport(top)
        mainlab <- paste(ifelse(id, paste("Node", node$nodeID,
            "(n = "), "n = "), sum(node$weights), ifelse(id,
            ")", ""), sep = "")
        grid.text(mainlab)
        popViewport()
        plot <- viewport(layout.pos.col = 2, layout.pos.row = 2,
            xscale = xscale, yscale = yscale, name = paste("node_barplot",
                node$nodeID, "plot", sep = ""))
        pushViewport(plot)
        if (beside) {
            #############################################################
            if(!horiz){
                xcenter <- cumsum(widths + gap) - widths/2
                for (i in 1:np) {
                    grid.rect(x = xcenter[i], y = 0, height = pred[i],
                      width = widths[i], just = c("center", "bottom"),
                      default.units = "native", gp = gpar(col = col[i],
                        fill = fill[i]))
                }
                if (length(xcenter) > 1)
                    grid.xaxis(at = xcenter, label = FALSE)
                grid.text(ylevels, x = xcenter, y = unit(-1, "lines"),
                    just = c("center", "top"), default.units = "native",
                    check.overlap = TRUE)
                grid.yaxis()
            } else {
                ycenter <- cumsum(widths + gap) - widths/2
                for (i in 1:np) {
                    grid.rect(y = ycenter[i], x = 0, width = pred[i],
                    height = widths[i], just = c("left", "center"),
                    default.units = "native", gp = gpar(col = col[i],
                     fill = fill[i]))
                }
                if (length(ycenter) > 1)
                    grid.yaxis(at = ycenter, label = FALSE)
                        grid.text(ylevels, y = ycenter, x = unit(-1, "lines"),
                        just = c("right", "center"), default.units = "native",
                         check.overlap = TRUE)
                grid.xaxis()
            }
        #############################################################
        }
        else {
            ycenter <- cumsum(pred) - pred
            for (i in 1:np) {
                grid.rect(x = xscale[2]/2, y = ycenter[i], height = min(pred[i],
                  ymax - ycenter[i]), width = widths[1], just = c("center",
                  "bottom"), default.units = "native", gp = gpar(col = col[i],
                  fill = fill[i]))
            }
            if (np > 1) {
                grid.text(ylevels[1], x = unit(-1, "lines"),
                  y = 0, just = c("left", "center"), rot = 90,
                  default.units = "native", check.overlap = TRUE)
                grid.text(ylevels[np], x = unit(-1, "lines"),
                  y = ymax, just = c("right", "center"), rot = 90,
                  default.units = "native", check.overlap = TRUE)
            }
            if (np > 2) {
                grid.text(ylevels[-c(1, np)], x = unit(-1, "lines"),
                  y = ycenter[-c(1, np)], just = "center", rot = 90,
                  default.units = "native", check.overlap = TRUE)
            }
            grid.yaxis(main = FALSE)
        }
        grid.rect(gp = gpar(fill = "transparent"))
        upViewport(2)
    }
    return(rval)
}
plot(ctree, terminal_panel = alt_node_barplot(ctree, horiz = TRUE))
ï»؟